
Reports

Your weekly report is already built

Tender, trip and carrier data is collected as your team works and shown on ready dashboards. Build your own views on any data and export any table

Live in days, not months.
Reports interface

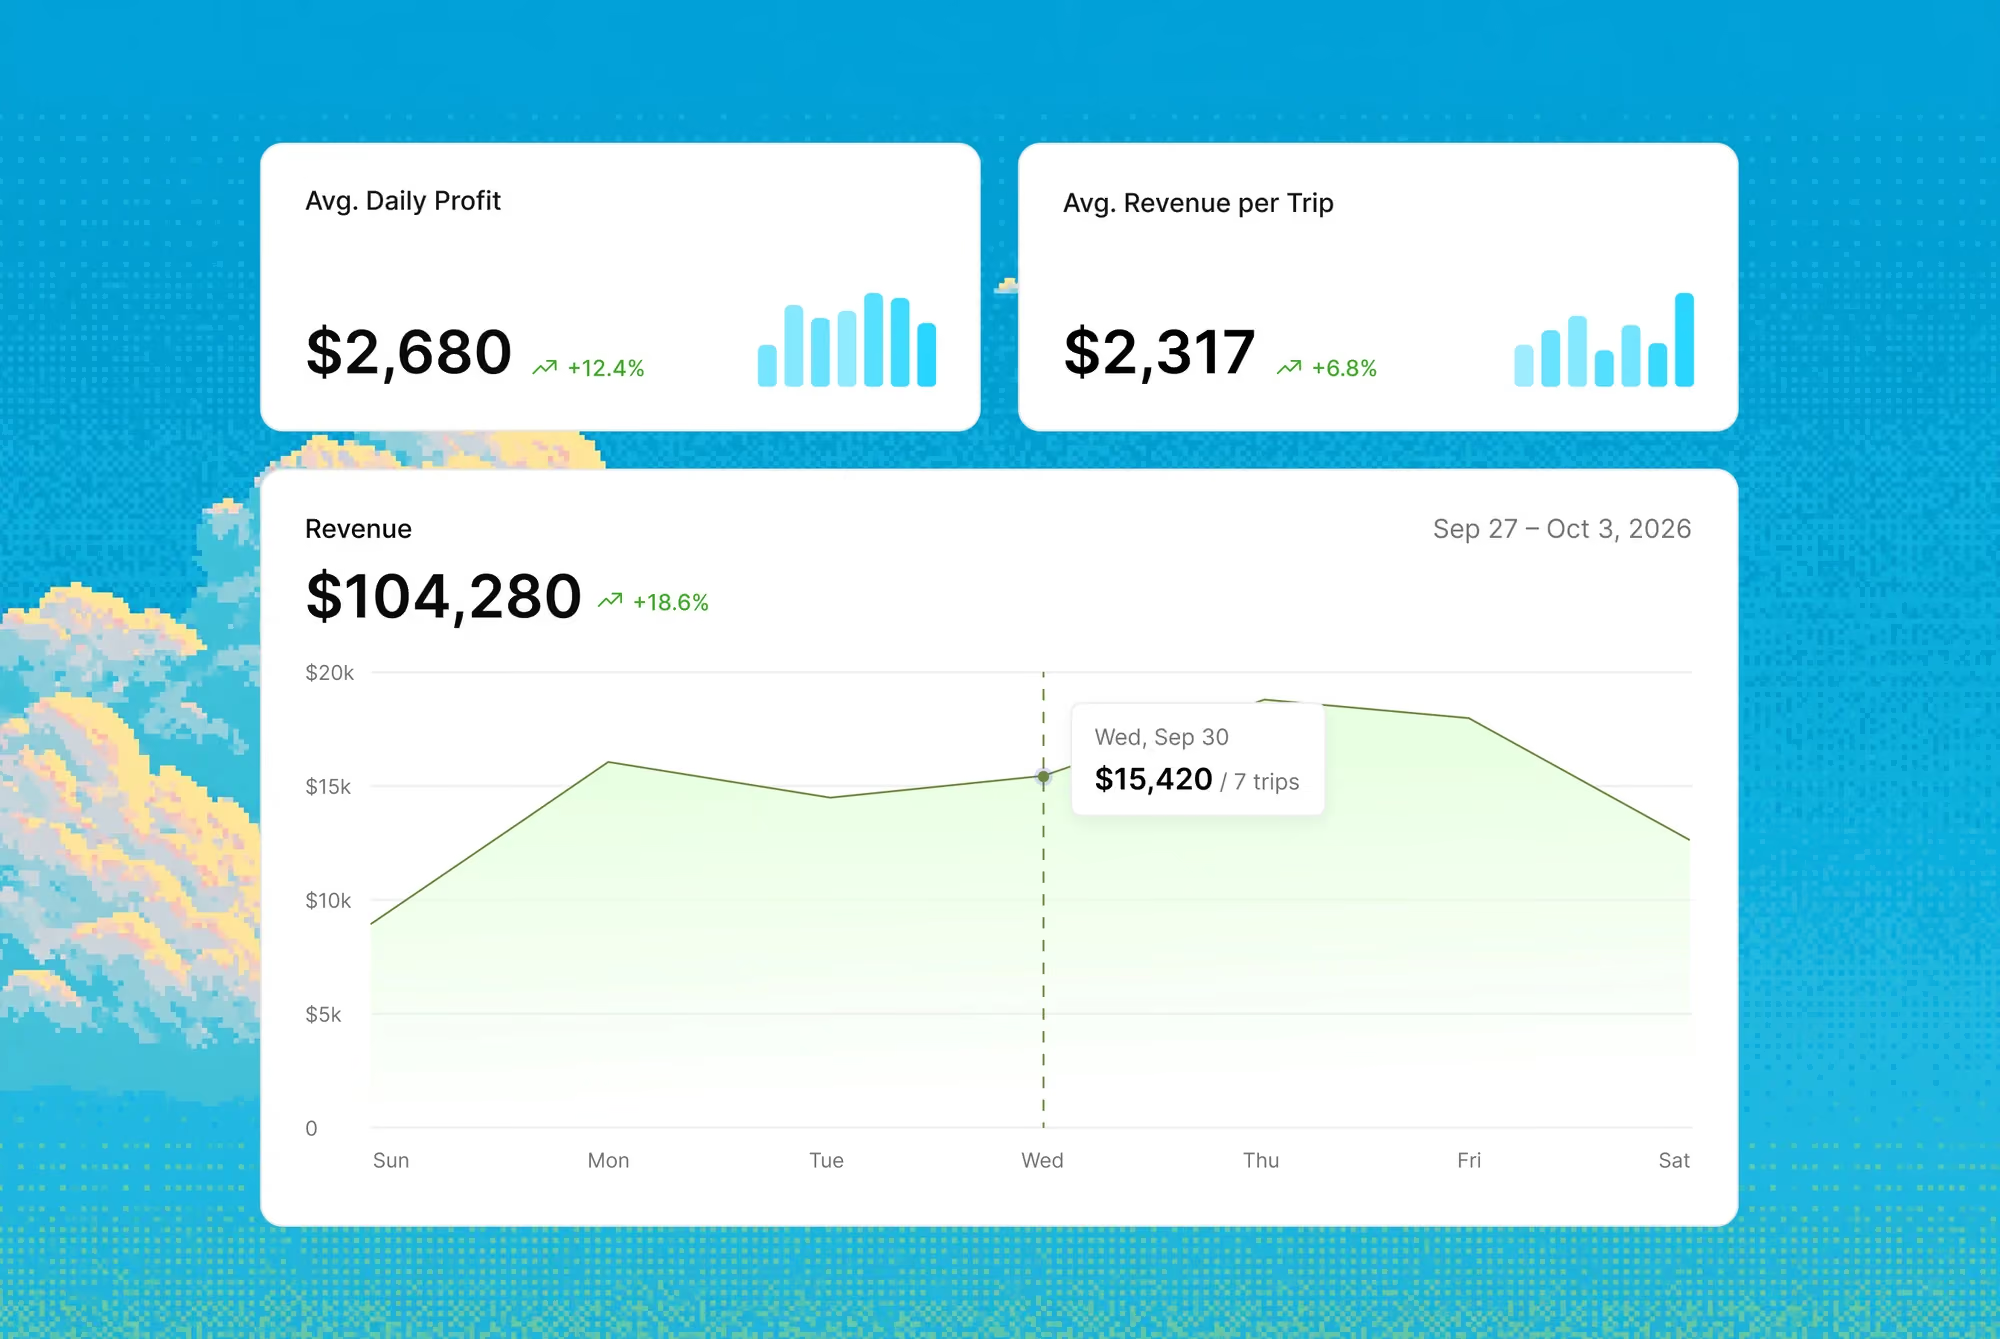
Reports turns the data your team already creates in Cargofy into dashboards, without manual exports. Shippers see bids per tender and on-time delivery by carrier, and carriers see trips per truck and which loads pay best

Features

The numbers your team needs, always up to date

On-time delivery, quote response time and loads per operator are copied from separate spreadsheets into one report by hand. With Reports, the data collects as your team works, and the dashboards are ready when you open them

Data collected as you work

Tender, trip and carrier data is gathered in the platform automatically

The numbers your customers ask for

On-time delivery per carrier and lane, bids per tender and rates by lane are on ready dashboards

Your own view of the data

Build dashboards on any platform data, including your own data models, and show the results as tables

Any table to Excel

Export any table for your own analysis

Pixel art scene of a logistics warehouse with red and yellow forklifts lined up by loading docks of a red brick building under large fluffy clouds, with a worker in red uniform holding a tablet on the right.
Why Cargofy

The numbers your team needs, always up to date

On-time delivery, quote response time and loads per operator are copied from separate spreadsheets into one report by hand. With Reports, the data collects as your team works, and the dashboards are ready when you open them

Data collected as you work

Tender, trip and carrier data is gathered in the platform automatically

The numbers your customers ask for

On-time delivery per carrier and lane, bids per tender and rates by lane are on ready dashboards

Your own view of the data

Build dashboards on any platform data, including your own data models, and show the results as tables

Any table to Excel

Export any table for your own analysis

Impact

With digital workers, everything changes

12 days

a year back from manual reporting

52

weekly reports a year, built automatically

100%

of tables exported in a single click

Integrations

Plays well with your stack

Highlight

Please don't put cases here. Cases in Solutions

Architect is the AI that sets up Cargofy for you. Send it a text or voice message, and it builds the fields, forms and workflows you need, or passes the task to an AI worker

Related primitives

Each agent operates within different contexts and sets of instructions, creating unique workflows and data models

Workflows involved

Weekly lane report
Pulls the week's loads, benchmarks every lane against the market and lands one page on your desk before the Monday meeting.
Fuel surcharge update
When the fuel index publishes, every lane's surcharge is recalculated, your records updated and customers and carriers notified — same day.
Data models
Rate
Pricing per lane and mode, filed with dates and small print attached. When a worker quotes, books or audits, the number comes out of this drawer.
Load
A bookable unit of freight: the shipments, the truck, the rate and the dates, stapled together. This is the file a dispatcher trades on all day.
Leg
One stretch of a longer journey: mode, ends, carrier and status per segment. Multimodal trips file as a chain of legs — and the chain is only as honest as each link.
Route
The planned path with stops: distance, transit time, mode and who runs it best. Lanes live here so nobody plans the same trip from scratch twice.
Accessorial
Extra charges, itemized: detention, liftgate, layover — each with its code, price and rules. The drawer that keeps surprises off the invoice, in both directions.
FAQ

Common Questions

Everything you need to know about deploying AI Digital Workers into freight operations — from how they work to how fast you can go live.‍

What is freight procurement analytics?

Freight procurement analytics measures how tenders perform, from bids per tender to rates by lane and carrier reliability. Cargofy Reports builds these dashboards from tender, bid and trip data collected in the platform

Can I build my own dashboards?

Yes. Build dashboards on any data in the platform, including your own data models, and show the results as tables

Can I export data from Cargofy?

Yes. Any table can be exported to Excel for your own analysis

Agent iconAgent iconAgent iconAgent icon

Ready to put a Digital Worker on the job?

Live in days, not months — connected to your TMS, load boards, and the 50,000-company Cargofy Network from day one.